After a regrettably lengthy hiatus from the blog, this article was inspired by the excellent aerodynamics segments of the ITV’s tour de France coverage (in collaboration with Southampton University).

Cycling aerodynamics in the 1980’s
A few years ago my colleague Dr Richard Lukes wrote a review paper titled “The understanding and development of cycling aerodynamics” published in the Sports Engineering journal. The paper handily tabulates a number of different cycling positions and equipment choices — along with the associated aerodynamic effect.
Cycling aerodynamics
The subject has been discussed at length in books and online, but I would like to briefly add my own thoughts. A cyclist maintaining a steady speed is subject to a number of resistive forces: the rolling resistance of the tyres, the friction in the chain and bearings and the aerodynamic resistance to motion — the force required to ‘push’ the air aside. Of all these forces aerodynamic drag is usually the greatest (at slow speeds and on steep hills this may not be the case) — at race speeds aerodynamics drag has been measured to account for 96% of total resistance [1]. The factors determining aerodynamic drag are complex, resistance to motion can be expressed as an equation we’ve used many times before:

The resistive force is equal to half of the product of: air density, airflow velocity (squared), the area in contact with the airflow and a factor which is referred to as the ‘drag coefficient’ — CD. CD is usually measured directly (in wind tunnel tests) and is determined by the shape of the rider (a ‘streamlined’ rider has a lower CD than one sat up in the airflow) and the nature of the airflow (whether it is laminar or turbulent).
Professional bike riders try to minimise aerodynamic equations by affecting on of the terms of the above equation. Streamlined tubes and helmets lower CD, textured fabrics create turbulent airflow (lowering resistance in the same way as the dimples on a golf ball) and changing riding position lowers area and CD. However, the greatest advantage comes from lowering the velocity of the airflow — due to the fact this term is squared. Since a professional rider doesn’t have the option to slow down, they tend to put something in the way of the air, e.g. another rider or the back of a team car. This video shows an extreme example of this.
Why lower drag?
Usually one of two reasons, to save energy, or to go faster. At a constant speed, we can think of the equation above as a balance; the force produced by the rider is equalled by the aerodynamic forces acting upon them (for the sake of simplicity I’m disregarding rolling resistance etc.). During a long day in the saddle a rider can maintain race speeds at much lower efforts by staying amongst the peloton. When staying in the bunch isn’t an option – during an individual time trial or solo breakaway – a rider wants to translate the power they produce into as much speed as possible. Lowering aerodynamic drag (either by reducing CD and/or A) allows velocity to increase without increasing the power requirement from the rider. This is useful if we assume that for any race the power (or force) a rider can maintain for any period of time is limited – equipment or riding positions which reduce aerodynamic drag are essential to create a competitive edge. A great example of this is Graeme Obree, while undoubtedly a great cyclist, his greatest advantages came from the innovations he created in bike design and body position which reduced his aerodynamic drag – they allowed him to go faster. In fact, Grappe et al. [2] measured the aerodynamic drag of the ‘Obree position’ and found it to be 20% lower than the standard ‘dropped’ position.
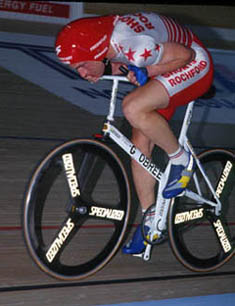
Grame Obree in his record breaking, aerodynamic position.
The equipment
So what equipment is worth using? The table below shows a selection of items taken from Dr Lukes’ paper, listing the aerodynamic advantage which can be obtained.
NB: Due to the complexity of drag and the dependence on rider size, velocity etc. All of these values should be taken as representative rather than absolute. Dr Lukes lists a number of sources in each case, I’ve taken the most recent values.
|
Innovation |
Aerodynamic force reduction |
Notes |
| Riding Position | All values compared to standard riding position (hands resting on brake hoods) [2] | |
| Dropped |
7.8% |
|
| Time Trial |
12.4% |
|
| Obree |
27.8% |
|
| Wheels | While these values seem massive, drag was measured for a single wheel in a wind tunnel. Therefore reduction is compared to a standard wheel not the bike/rider system. [3] | |
| Disc Wheel |
70% |
|
| Aerodynamic spoked wheel |
60% |
|
| Frame type | ||
| Lotus Monocoque frame |
16% |
Value of aerodynamic reduction with rider. Frame type now banned by UCI [1] |
| Clothing | ||
| Lycra Suit |
11% |
[4] |
| Aerohat |
7% |
UCI regulations now require headwear to be protective – aerodynamic helmets still effective |
| Exchange trousers and jacket for tight fitting clothing |
30% |
[5] |
| Exchange wool suit for lycra |
7.6-8.4% |
[6] |
| Exchange polypropylene suit for lycra |
9.8-10.5% |
[6] |
| Drafting | ||
| Directly behind rider |
49% |
[7] |
| 30 cm wheel gap |
38% |
[8] |
| 2 m wheel gap |
27% |
[8] |
What’s clear is that many of these values are quite significant and illustrate why the UCI felt compelled to ban some of these innovations (Graeme Obree’s riding position and the monocoque frame). It is easy to see the magnitude of advantage that can be gained by adopting as many innovations as possible. It is after all Dave Brailsford’s ‘aggregation of marginal gains’ which is thought to be a great contributor to the success of British cycling.
Power and speed
To illustrate the effect in a typical cycling scenario I’ve used a model on the cycling power lab website. There are a huge number of factors which influence rider performance – this model allows us to control the environment very strictly to create a number of ‘what if’ scenarios. I’ve chosen a very simple case with:
- Rider + bike mass = 85 kg
- 0% incline
- no wind
I’ve then used the model to calculate two scenarios based on % aerodynamic drag reduction from the ‘standard riding’ position (a rider riding with their hands on the top of the handlebars).
- The power required to maintain a speed of 40 kph
- The speed which can be maintained with a power output of 400 watts (this is a HIGH power output which can only be realistically maintained by high level cyclists for any period of time).

While the model doesn’t account for everything, the graph above does illustrate what advantage can be gained from reducing aerodynamic drag. When speed is kept constant, power requirement reduces considerably. This isn’t the case with riding speed at a constant power output. The fact that aerodynamic drag is proportional to speed squared makes these gains much more modest. However, they’re enough for considerable winning margins over distance.
If you’re a time trialler or keen cyclist you may find the power model useful. It allows you to calculate cycling speed based on power output and aerodynamic drag – great for testing different equipment scenarios and expected gains in speed.
Despite the considerable advantages which can be gained, the high tech approach isn’t for everyone. Purists argue that it allows ‘lesser’ cyclists to compete with records set by cycling greats such as Eddie Mercx; disc wheels and monocoque frames allow for higher speeds at lower powers. I have to admit, despite the science and the compelling evidence it will be a long time before I’m ready to give up my one-piece woollen racing suit.
Simon Choppin
P.S. For anyone interested in just how far aerodynamics advantage can be pushed, I encourage you to follow Graeme Obree’s latest record breaking attempt in a human powered vehicle (HPV)
http://www.cyclingweekly.co.uk/news/latest/539078/graeme-obree-s-record-attempt-gathers-pace.html
References:
[1] Hill, R.D. (1993) Design and development of the LotusSport pursuit bicycle. Proceedings of the Institution of Mechanical Engineers, Part D: Journal of Automobile Engineering, 207 (4), 285–294.
[2] Grappe, F., Candau, R., Belli, A. & Rouillon, J.D. (1997) Aerodynamic drag in field cycling with special reference to the Obree’s position. Ergonomics, 40 (12), 1299–1311.
[3] Tew, G.S. & Sayers, A.T. (1999) Aerodynamics of yawed racing cycle wheels. Journal of Wind Engineering & Industrial Aerodynamics, 82 (1), 209–222.
[4] Kyle, C.R. & Burke, E.R. (1984) Improving the racing bicycle. Mechanical Engineering, 106 (9), 34–35.
[5] Pons, D.J. & Vaughan, C.L. (1989) Mechanics of cycling. In: Biomechanics of Sport (ed. Vaughan, C.L.) CRC Press, pp. 289–315.
[6] Kyle, C.R. (1991) Wind tunnel tests of aero bicycles. Cycling Science, 3 (1), 57–61.
[7] Zdravkovich, M.M., Ashcroft, M.W., Chisholm, S.J. & Hicks, N. (1996) Effect of cyclist’s posture and vacinity of another cyclist on aerodynamic drag. In: 1st International Conference on the Engineering of Sport (ed. Haake, S.J.) A.A. Balkema, Sheffield, UK, pp. 21–28.
[8] Kyle, C.R. (1979) Reduction of wind resistance and power output of racing cyclists and runners travelling in groups. Ergonomics, 22 (4), 387–397.

